
What Is a Good BMI? Chart and Limits
What is a good BMI? For most adults a healthy BMI runs 18.5 to 24.9, but the number has real blind spots. See the full chart by age, sex, and body type.
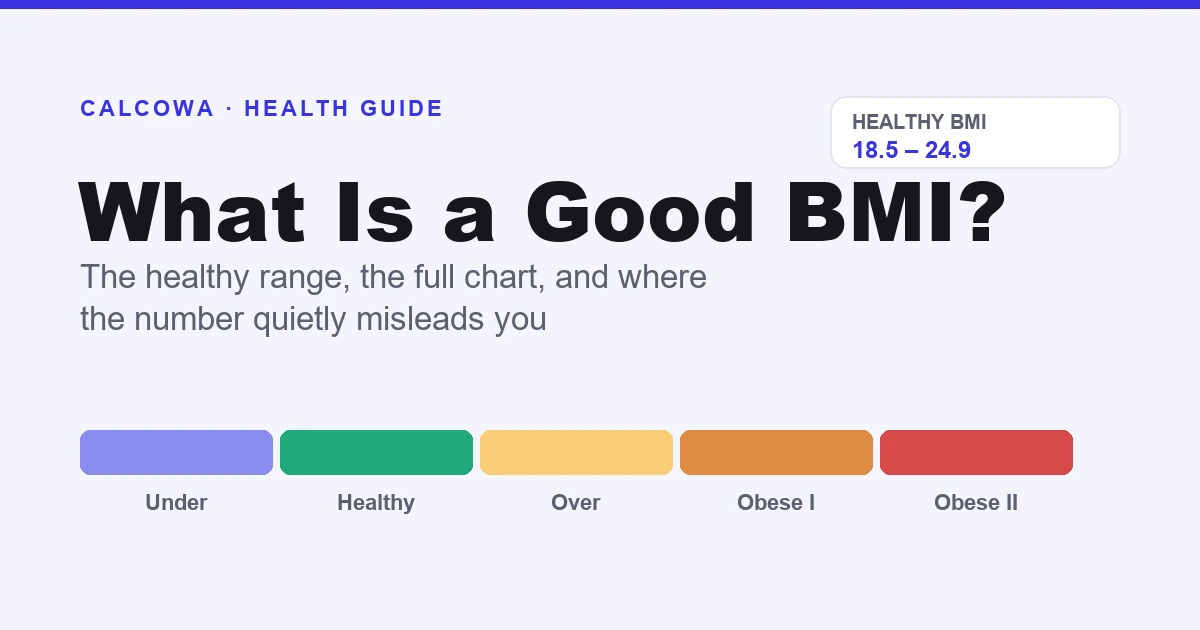
Short answer: a good BMI for most adults is 18.5 to 24.9, the healthy weight range set by the World Health Organization and the CDC. So when people ask what is a good BMI, that band is the number to remember. Below it you’re underweight, 25 to 29.9 is overweight, and 30 or higher lands in the obesity categories. Here’s the catch worth knowing up front: BMI is a fast screening tool, not a health verdict. It uses only your height and weight, so it can’t tell muscle from fat or see where you store it. This guide gives you the full chart, shows how the number shifts in meaning by age and body type, and explains what to check alongside it.
If you’d rather skip the arithmetic, the BMI calculator gives you the number in seconds. Everything below explains what that number actually means and where it goes wrong.
What is a good BMI?
Your Body Mass Index is a single number that compares your weight to your height. It doesn’t measure fat directly. It just asks whether your weight is high, low, or about right for how tall you are, then sorts you into a category. For adults, those categories are fixed and don’t change with age or sex.
| BMI | Category |
|---|---|
| Below 18.5 | Underweight |
| 18.5 to 24.9 | Healthy weight |
| 25.0 to 29.9 | Overweight |
| 30.0 to 34.9 | Obesity (class 1) |
| 35.0 to 39.9 | Obesity (class 2) |
| 40.0 and above | Obesity (class 3) |
The healthy band is wide on purpose. A BMI of 19 and a BMI of 24 are both perfectly good, and neither is better than the other in any meaningful way. What matters is landing inside the range and, more importantly, understanding what the number can and can’t tell you. That’s where most BMI advice stops, and it’s exactly where the useful part begins.
How do you calculate your BMI?
The formula is simple, and it comes in two flavors depending on your units. In metric, you divide your weight in kilograms by your height in meters squared. In imperial, you multiply your weight in pounds by 703, then divide by your height in inches squared.
| Units | Formula | Example |
|---|---|---|
| Metric | kg ÷ (m × m) | 73 ÷ (1.75 × 1.75) = 23.8 |
| Imperial | (lb × 703) ÷ (in × in) | (160 × 703) ÷ (69 × 69) = 23.6 |
Take a person who’s 5 foot 9, which is 69 inches, weighing 160 pounds. Multiply 160 by 703 to get 112,480, then divide by 69 squared, which is 4,761. That lands at 23.6, comfortably in the healthy range. The two formulas give the same answer once you account for rounding. Rather than square heights by hand, drop your numbers into the BMI calculator and it handles both unit systems instantly.
Here’s a small trick that makes your result easier to read: divide your BMI by 25. This gives you a “BMI prime” figure where anything under 1.0 is in the healthy-to-overweight boundary. A prime of 0.94 (our 23.6 example) tells you you’re at 94 percent of the overweight threshold, a clearer sense of headroom than the raw number gives.
What is a good BMI by age?
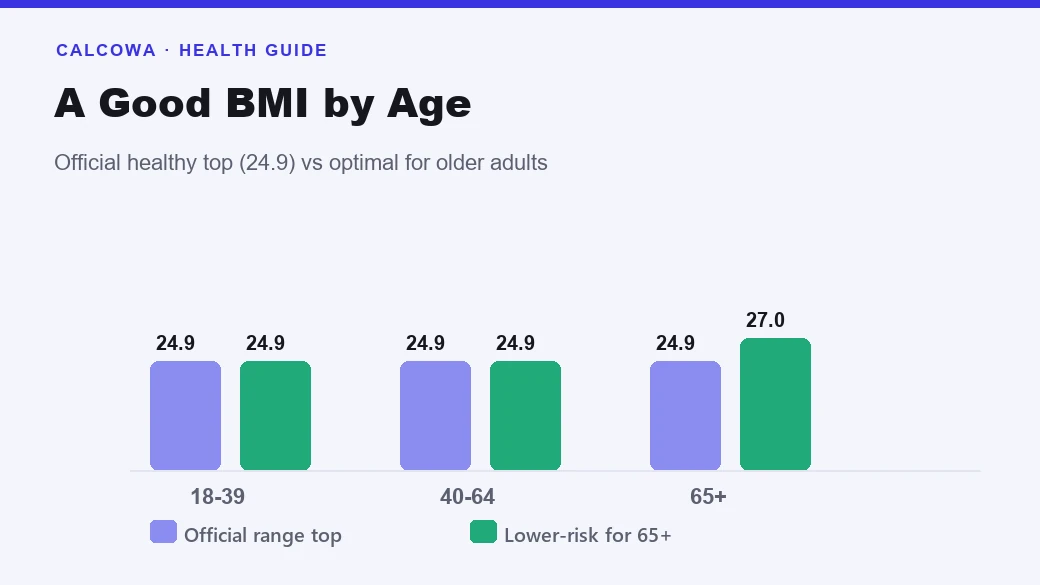
This is where the official answer and the real-world answer drift apart, and most charts won’t tell you. On paper, the healthy BMI range is 18.5 to 24.9 for every adult, whether you’re 25 or 75. Doctors use that same band across all ages. So officially, a good BMI doesn’t change as you get older.
The research adds a wrinkle, though. Several large studies of older adults have found that the lowest risk of death sits a little higher than the standard range, often in the mid-20s, once people pass 65. The likely reason is that a small reserve of weight helps you weather illness, surgery, and the natural muscle loss that comes with age.
| Age group | Official healthy BMI | What the research suggests |
|---|---|---|
| 18 to 39 | 18.5 to 24.9 | Standard range fits well |
| 40 to 64 | 18.5 to 24.9 | Standard range still applies |
| 65 and older | 18.5 to 24.9 | A BMI up to about 27 often ties to lower risk |
Don’t read that as permission to gain weight freely in later life. It means an older adult sitting at 26 usually isn’t the worry it would be at 40, and a slightly fuller frame in your 70s can be protective rather than harmful. For anyone building a plan, run your energy needs through the TDEE calculator so the target you pick fits your age and activity, not a one-size chart.
Is a good BMI different for men and women?
The cutoffs are the same. A good BMI is 18.5 to 24.9 for men and for women, with no separate chart for each sex. BMI was built as a population screen that deliberately ignores sex, which keeps it simple but also loses information.
What actually differs is what sits behind the number. Women naturally carry more essential body fat than men, roughly 10 to 13 percent versus 2 to 5 percent, because some of it supports hormones and reproduction. So a man and a woman with the exact same healthy BMI can have noticeably different body fat percentages, and both are normal. This is one reason BMI struggles at the individual level. If you want a read that respects the difference between male and female bodies, body fat percentage does it far better, and our guide on a healthy body fat percentage breaks down the separate charts for each sex.
Does BMI work for athletes and muscular people?
Here’s BMI’s biggest failure, and it’s worth understanding clearly. Muscle is denser than fat, so it weighs more for the same volume. Because BMI only knows your total weight, it counts that heavy muscle as if it were excess, and it can shove a genuinely lean person into the overweight or obese range.
| Person | Height and weight | BMI | BMI category | Reality |
|---|---|---|---|---|
| Muscular lifter | 5’10”, 200 lb | 28.7 | Overweight | Lean, about 14% fat |
| Average adult | 5’10”, 175 lb | 25.1 | Overweight (edge) | Genuinely healthy |
| Lightly built, low muscle | 5’6”, 130 lb | 21.0 | Healthy | ”Skinny fat,” high fat share |
Look at the top and bottom rows. The athlete gets flagged as overweight while carrying single-digit-plus body fat, and the lightly built person passes BMI while quietly holding too much fat for their frame. BMI can’t see either problem, because it never measures fat. If you train hard and your BMI reads high, that’s not a red flag on its own. Check your body fat with the body fat calculator or measure your waist, and you’ll get the truth BMI can’t give you.
Do BMI cutoffs change by ethnicity?
For some populations, yes, and this rarely makes it into standard BMI charts. Research shows that people of South Asian, East Asian, and Southeast Asian descent tend to develop higher body fat and greater health risk at a lower BMI than the general cutoffs assume. To reflect that, the World Health Organization set lower action points for these groups.
| Population | Overweight action point | Obesity action point |
|---|---|---|
| General cutoffs | 25.0 and above | 30.0 and above |
| Asian populations | 23.0 and above | 27.5 and above |
The practical takeaway is that if you’re of Asian descent, a “healthy” BMI of 24 by the standard chart may already carry the risk the general chart doesn’t flag until 27 or higher. It doesn’t mean the number is wrong, it means the threshold for paying attention sits lower for you. This is another case where a waist measurement earns its keep, since it catches the abdominal fat that drives much of that added risk.
What is a healthy BMI for children and teens?
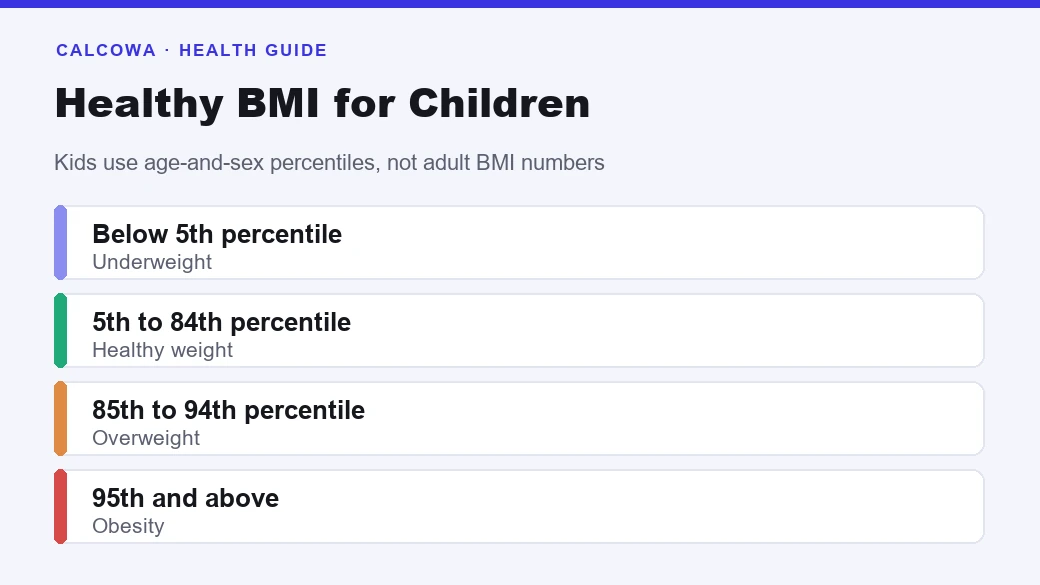
Adult BMI numbers don’t apply to kids, and using them is a common mistake. Children and teenagers are still growing, and their healthy weight shifts constantly with age and sex. So instead of the fixed 18.5-to-24.9 band, their BMI is plotted against growth charts and expressed as a percentile, comparing them to other children of the same age and sex.
| Percentile | Category |
|---|---|
| Below 5th | Underweight |
| 5th to 84th | Healthy weight |
| 85th to 94th | Overweight |
| 95th and above | Obesity |
A child in the 60th percentile has a higher BMI than 60 percent of kids their age and sex, and that’s squarely healthy. The categories look nothing like the adult ones, which is why you should never judge a 12-year-old against grown-up BMI numbers. If you’re checking a child’s weight, a pediatrician reading the growth chart is the right call, not an adult BMI table.
What health risks are linked to BMI?
BMI earns its place because, across large groups, it tracks health risk reasonably well. As BMI rises above the healthy range, so does the average risk of conditions like type 2 diabetes, high blood pressure, heart disease, and several others. The relationship isn’t perfectly straight, and it’s a U-shape at the extremes, since being underweight carries its own risks too.
| BMI range | Relative health risk (population average) |
|---|---|
| Below 18.5 | Increased (undernutrition, low bone density) |
| 18.5 to 24.9 | Lowest |
| 25.0 to 29.9 | Mildly increased |
| 30.0 to 34.9 | High |
| 35.0 and above | Very high |
The key phrase there is population average. These risks describe what happens across thousands of people, not the guarantee for any single person. Plenty of individuals in the overweight band are metabolically healthy, and some in the healthy band aren’t. That’s why BMI works well for public health and screening, yet needs backup when you’re looking at one specific body, which is you.
What should you check besides BMI?
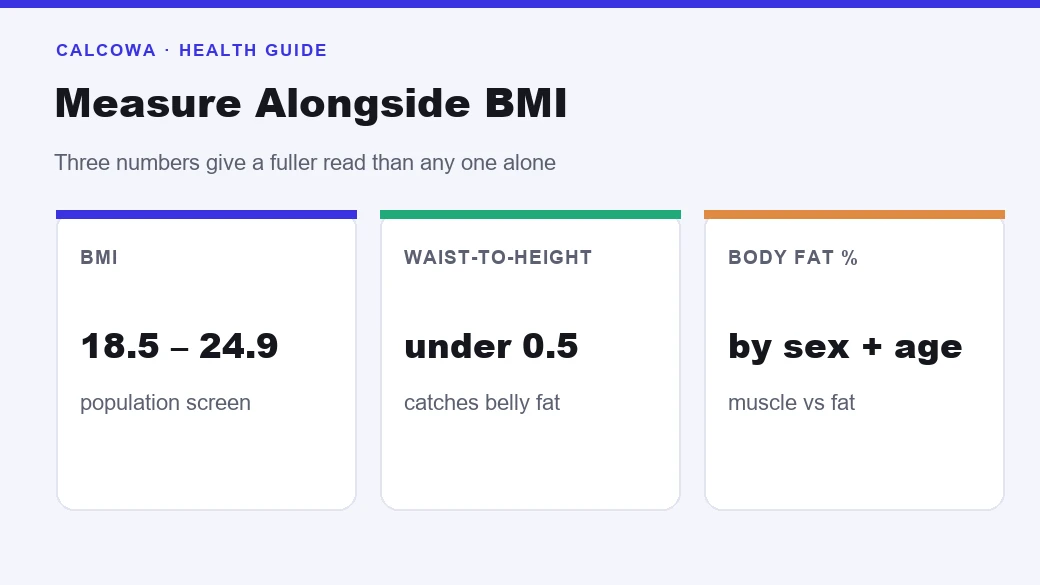
Since BMI misses so much on its own, the smart move is to pair it with a couple of measures that fill its gaps. The best partner is your waist, because deep abdominal fat is the kind most linked to disease, and BMI can’t detect it at all. Measure your waist at the navel and divide it by your height in the same units to get your waist-to-height ratio.
| Waist-to-height ratio | What it suggests |
|---|---|
| Under 0.4 | Possibly too lean, worth checking |
| 0.4 to 0.49 | Healthy range |
| 0.5 to 0.59 | Raised risk, worth trimming |
| 0.6 and above | High risk, act on it |
Keeping your waist under half your height, a ratio below 0.5, is a simple, well-supported target that works across heights and body types. Body fat percentage is the third measure worth knowing, especially if you’re muscular and BMI overstates you. Track BMI, waist, and ideally body fat together, and you get a picture no single number can give. Our guide on a healthy body fat percentage shows how to measure that last one without a lab.
How do you get to a healthy BMI?
If your BMI sits above the healthy range and your waist confirms it’s fat rather than muscle, the path down is a moderate calorie deficit, eating a bit less than you burn so your body taps its stores. There’s no trick to it, just consistency. A safe pace of half a pound to a pound a week usually shifts your BMI by about one point every month or two, depending on your height.
Two things keep the weight you lose from being muscle. First, eat enough protein, roughly 0.7 to 1 gram per pound of bodyweight, which protects lean tissue during a cut. Second, keep doing some strength training, since it signals your body to hold onto muscle. Skip both and a crash diet will strip muscle alongside fat, lowering the metabolism you’re trying to preserve. To size a sensible deficit, our guide on how many calories to lose weight does the math, and how to lose weight the healthy way ties the eating and training together.
If you’re underweight instead, the same logic runs in reverse. A small calorie surplus paired with resistance training adds weight as muscle rather than just fat. Whichever direction you’re headed, judge progress by the trend across months, not the number that greets you on any single morning. BMI is a slow-moving marker, and that’s fine. A good BMI is a range you settle into and hold, not a target you chase day to day.
Frequently asked questions
A good BMI for most adults is 18.5 to 24.9, which is the healthy weight range used by the World Health Organization and the CDC. Below 18.5 is underweight, 25 to 29.9 is overweight, and 30 or higher falls into the obesity categories. That single band applies to men and women aged 18 to 64 alike, since the adult cutoffs don't change by sex. The one thing to remember is that BMI is a screen, not a diagnosis. It flags where you sit on a population chart, but it can't see whether your weight is muscle or fat, so treat a healthy BMI as a green light to check other markers rather than a final verdict on your health.
Yes, a BMI of 24 sits comfortably inside the healthy weight range of 18.5 to 24.9, right near the top of it. For most people that's a perfectly good number and nothing to worry about. The only nuance is context. If you lift weights seriously and carry a lot of muscle, a BMI of 24 might actually understate how lean you are, and if you're very sedentary with little muscle, the same 24 could hide more fat than the number suggests. Either way it's a healthy reading, so pair it with a waist measurement and you'll have a fuller picture than BMI gives on its own.
The official healthy BMI range, 18.5 to 24.9, is the same for every adult age, so on paper a good BMI doesn't shift as you get older. In practice, research on people over 65 tells a slightly different story, with several studies linking a BMI in the mid-20s to lower mortality in older adults, likely because a small reserve of weight helps during illness and protects against muscle loss. So while doctors still use the standard range, an older adult sitting at 26 or 27 usually isn't a concern the way it might be at 40. For children and teens, BMI is read as an age-and-sex percentile, not these adult numbers.
The BMI cutoffs are identical for men and women, so a good BMI is 18.5 to 24.9 for both. What differs is body composition behind the number. Women naturally carry more essential body fat than men, so a man and a woman at the same healthy BMI can have quite different body fat percentages, and that's normal. BMI was designed as a population screen that ignores sex on purpose, which is part of why it's imperfect for individuals. If you want a sex-aware read on your body, body fat percentage does that job far better than BMI, since it accounts for the different amounts of fat men and women naturally hold.
Not really, and this is BMI's most famous blind spot. Muscle is denser than fat, so a lean, muscular person can weigh a lot for their height and land in the overweight or even obese BMI range while carrying very little fat. A 200-pound athlete at 5 foot 10 reads a BMI of 28.7, which BMI labels overweight, even at 14 percent body fat. BMI can't tell muscle from fat because it only uses height and weight. If you train hard and your BMI looks high, don't panic. Measure your body fat or your waist instead, since those see through the muscle that BMI mistakes for excess weight.
Waist circumference and waist-to-height ratio are the two best companions to BMI, because they capture where you store fat, which BMI completely misses. Deep belly fat around your organs carries more health risk than fat elsewhere, and a tape measure catches it. A simple, well-supported target is keeping your waist under half your height, so waist-to-height below 0.5. Body fat percentage is the third useful measure, especially if you're muscular and BMI overstates your weight. Together these give you a much fuller read than BMI alone, which is why clinicians increasingly pair a BMI number with a waist measurement rather than relying on either by itself.
Yes, it's possible, though it gets less common as BMI climbs. Some people in the overweight range, and a smaller share in the lower obese range, have healthy blood pressure, blood sugar, and cholesterol along with good fitness, a pattern researchers call metabolically healthy overweight. Muscular athletes are the clearest example, since their high BMI is muscle, not fat. That said, the odds of health problems do rise with BMI across a population, so a high number is still worth taking seriously as a prompt to check your other markers. It means look closer, not automatically that something's wrong, but it isn't a number to ignore either.
Getting to a healthy BMI comes down to a steady calorie deficit if you need to lose weight, paired with enough protein and some strength training so the weight you drop is fat rather than muscle. A safe pace is about half a pound to a pound a week, which usually moves your BMI by roughly one point every month or two depending on your height. Crash diets backfire because they burn muscle, which lowers the metabolism you're trying to keep. If you're underweight instead, the same logic runs in reverse, a small calorie surplus with resistance training. Either way, track the trend over months, not daily weigh-ins.
Calcowa's editorial team builds and checks every calculator against published formulas, then writes these guides so the numbers make sense. Each tool shows its formula and a worked example. See our methodology.
Related guides
Target Heart Rate Zones for Fat Loss
Target heart rate zone for fat loss runs about 60 to 70 percent of your max heart rate, but higher zones burn more total fat. Get the full chart and math.
Health & FitnessCalories Burned Walking: A Complete Guide
Calories burned walking depends on your weight, pace, and incline. A 155-pound person burns about 86 calories per mile at a moderate pace. See the charts.
Health & FitnessWhat Is a Healthy Body Fat Percentage?
A healthy body fat percentage depends on your sex and age. See the full range charts, how to measure yours accurately, and why it beats BMI as a marker.