
How to Calculate Standard Deviation Step by Step
How to calculate standard deviation: find the mean, square each value's distance from it, average the squares, then take the square root. Worked examples.
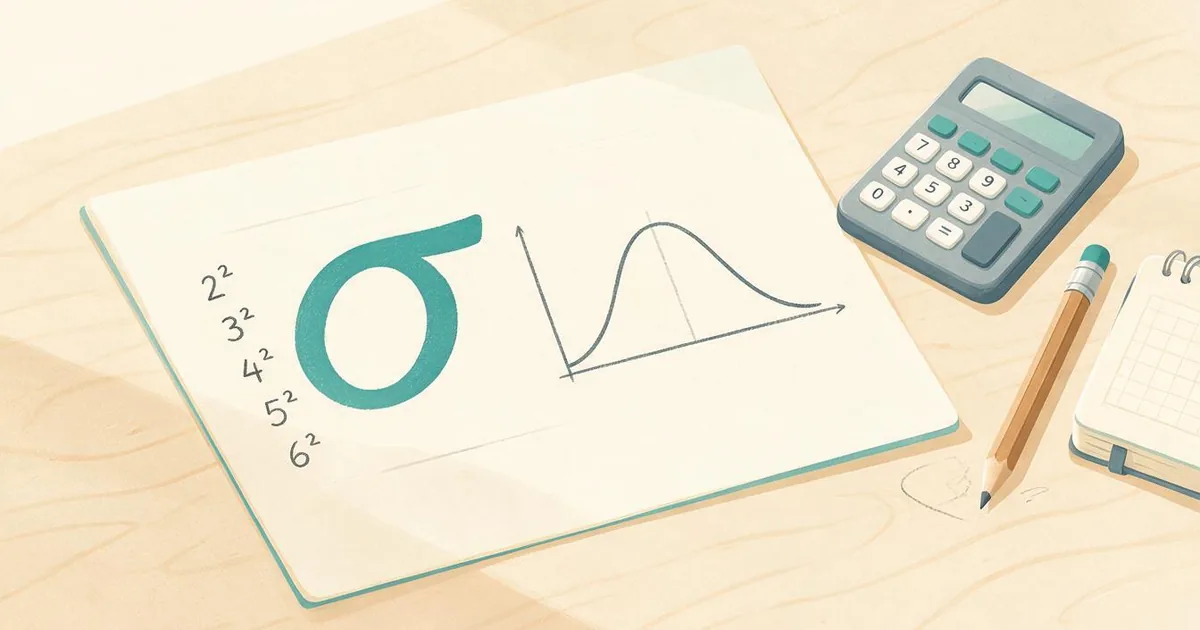
Short answer: to calculate standard deviation, find the mean, subtract it from each value and square the result, average those squared differences, then take the square root. For the test scores 66, 74, 82, 88, and 90, the mean is 80, the squared differences add up to 400, and the population standard deviation works out to about 8.9. That’s the whole method, but the details trip people up: whether to divide by N or n - 1, what the answer actually means, and which spreadsheet function matches which formula. This guide on how to calculate standard deviation walks through every step by hand, shows both formulas on the same data set, and decodes the Excel and calculator buttons.
Want to skip the arithmetic? The standard deviation tool accepts any data set, shows both the sample and population results, and lists the intermediate steps so you can follow the work.
What Is Standard Deviation?
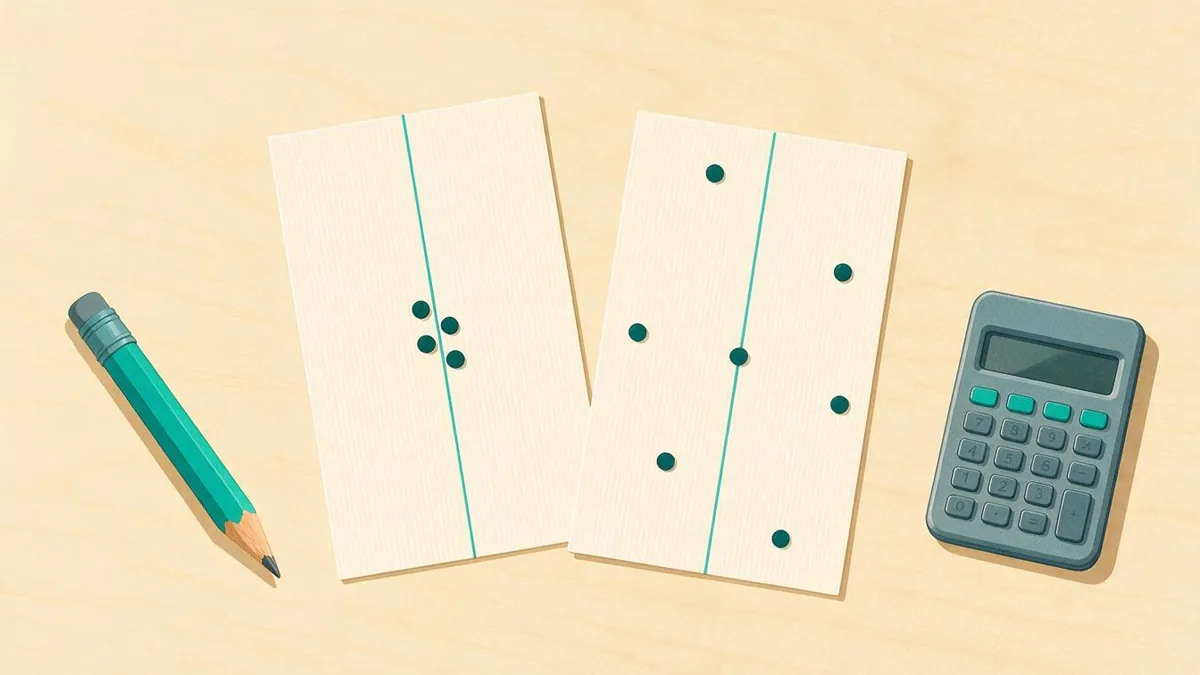
Standard deviation measures how spread out a data set is around its mean. A low standard deviation means the values huddle close to the average; a high one means they’re scattered far from it. It’s the single most used number in statistics after the mean itself, because an average alone hides almost everything interesting about data.
Two basketball players make the point. Both average exactly 20 points a game over five games, yet they’re nothing alike:
| Player | Game scores | Mean | Sample standard deviation |
|---|---|---|---|
| Player A | 18, 20, 22, 19, 21 | 20 | 1.6 |
| Player B | 5, 35, 10, 30, 20 | 20 | 12.7 |
Player A delivers 20 points like clockwork. Player B might drop 35 or might barely score. The mean can’t tell those stories apart; the standard deviation can. That’s why it shows up everywhere spread matters: grading curves, quality control, weather records, investment risk, lab results. In finance it literally is the standard measure of risk. Two funds can both average 8% a year, but the one whose annual returns swing with a standard deviation of 18% will hand you a very different ride than the one sitting at 5%.
The units always match the original data. If you’re measuring dollars, the standard deviation is in dollars. If it’s minutes, the answer is in minutes. That’s one of its biggest advantages over variance, which we’ll get to later.
What Is the Standard Deviation Formula?
The standard deviation formula comes in two versions, and the only difference is one number in the denominator.
Population standard deviation: σ = √( Σ(x - μ)² / N )
Sample standard deviation: s = √( Σ(x - x̄)² / (n - 1) )
In words: subtract the mean from each value, square each result, add the squares up, divide by N (population) or n - 1 (sample), and take the square root. The symbols scare people more than the math does, so here’s the full decoder:
| Symbol | Name | What it means |
|---|---|---|
| σ | sigma (lowercase) | Population standard deviation |
| s | s | Sample standard deviation |
| σ², s² | sigma squared, s squared | Population and sample variance |
| μ | mu | Population mean |
| x̄ | x-bar | Sample mean |
| Σ | sigma (uppercase) | “Sum of” - add up everything that follows |
| N | big N | Number of values in a whole population |
| n | little n | Number of values in a sample |
So Σ(x - μ)² just reads as “take each value, subtract the mean, square it, and add all of those up.” Every calculation in this guide is that phrase turned into arithmetic.
How to Calculate Standard Deviation by Hand?
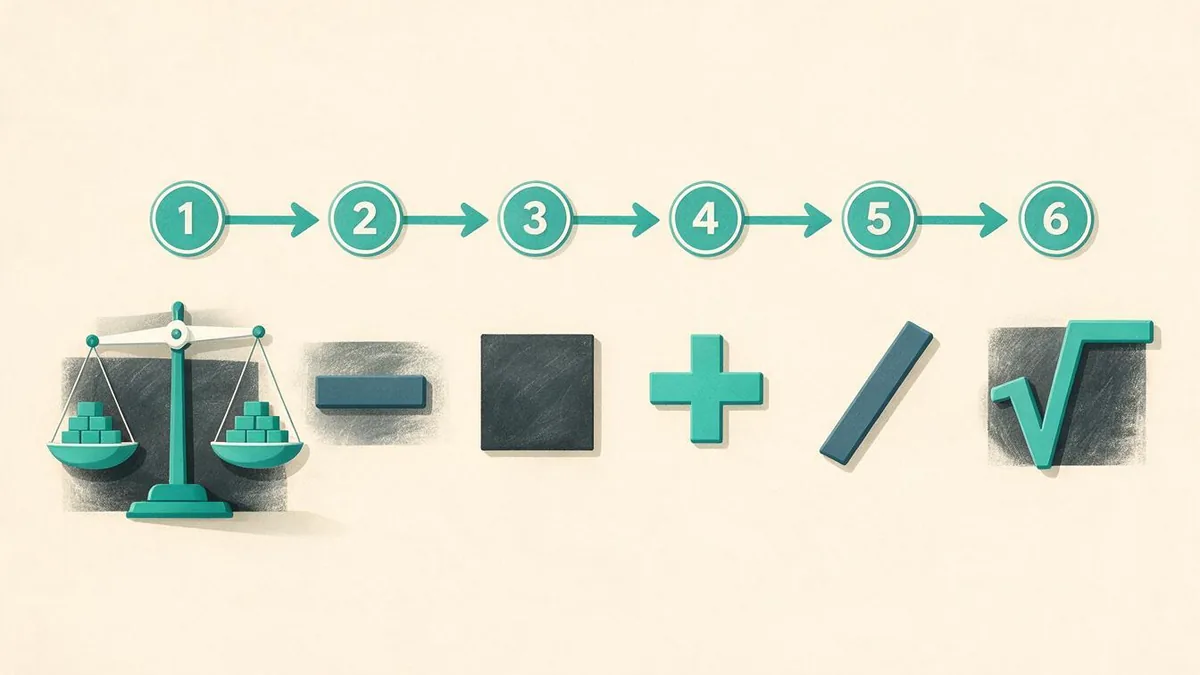
Here’s how to find standard deviation in six steps, worked on a real data set: five quiz scores of 66, 74, 82, 88, and 90.
Step 1: find the mean. Add the values and divide by how many there are. 66 + 74 + 82 + 88 + 90 = 400, and 400 / 5 = 80. (For messier data sets, the mean, median and mode tool does this part instantly.)
Step 2: subtract the mean from each value. These are the deviations. They must add up to zero, which is a free arithmetic check.
Step 3: square each deviation. Squaring makes every number positive and weights far-away values more heavily.
| Score | Deviation (score - 80) | Squared deviation |
|---|---|---|
| 66 | -14 | 196 |
| 74 | -6 | 36 |
| 82 | 2 | 4 |
| 88 | 8 | 64 |
| 90 | 10 | 100 |
| Total | 0 ✓ | 400 |
Step 4: add the squared deviations. 196 + 36 + 4 + 64 + 100 = 400.
Step 5: divide to get the variance. Divide by N = 5 if these five scores are the entire group you care about: 400 / 5 = 80. Divide by n - 1 = 4 if they’re a sample from a bigger group: 400 / 4 = 100.
Step 6: take the square root. √80 ≈ 8.94 for the population version, √100 = 10 for the sample version.
Done. If this was the whole class, the scores typically sit about 9 points from the average of 80. If it was five students sampled from a bigger class, the best estimate of spread is 10 points. You can check every step against your own numbers and see the same table generated automatically.
Should You Use the Population or Sample Formula?
This is the step that splits answers, so it deserves its own decision. Use the population formula when your data set is every value you care about: all 30 students in your class, all 12 months of your own spending, every unit a machine produced today. Use the sample formula when your data stands in for a bigger group you couldn’t measure: 50 shoppers surveyed out of thousands, 20 soil readings from a whole field.
Why n - 1? A sample’s values are always a little closer to their own average than to the true population mean, so dividing by n underestimates the spread. Dividing by n - 1, known as Bessel’s correction, stretches the answer just enough to compensate. Here’s the same data set from above run through both formulas side by side:
| Step | Population (σ) | Sample (s) |
|---|---|---|
| Sum of squared deviations | 400 | 400 |
| Divide by | N = 5 | n - 1 = 4 |
| Variance | 80 | 100 |
| Standard deviation | 8.94 | 10.00 |
Same data, answers about 12% apart. The gap shrinks as the data set grows: with 100 values, dividing by 99 instead of 100 barely moves the result. With 5 values, it clearly matters.
When in doubt, use the sample formula. Most real-world data is a sample of something larger, which is why spreadsheets default to it. Statistics classes usually tell you which one they want, and grading keys do punish the wrong denominator.
What Does Standard Deviation Actually Tell You?
A standard deviation on its own is just a number. Its power shows up when your data is roughly bell-shaped, because then the empirical rule, also called the 68-95-99.7 rule, turns it into predictions:
| Range | Share of values | Quiz example (mean 80, s = 10) |
|---|---|---|
| Within 1 standard deviation | about 68% | 70 to 90 |
| Within 2 standard deviations | about 95% | 60 to 100 |
| Within 3 standard deviations | about 99.7% | 50 to 110 |
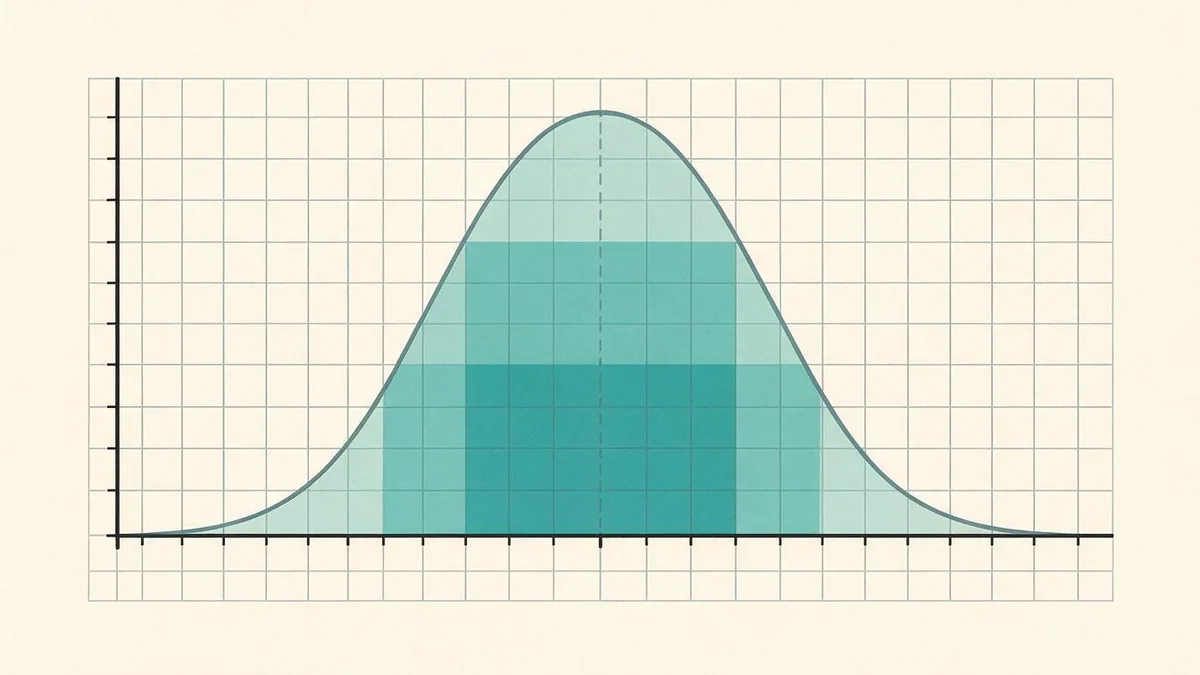
So if a large class averages 80 with a standard deviation of 10, roughly two thirds of students scored between 70 and 90, and a score below 60 puts a student in about the bottom 2.5%. Counting how many standard deviations a value sits from the mean is exactly what a z-score measures, and it’s how curved grades and growth charts are built.
The other interpretation trick is judging whether a standard deviation is “big.” Raw size means nothing without the mean next to it, so divide the standard deviation by the mean to get the coefficient of variation (CV), a percentage you can compare across any two data sets:
| Data set | Mean | Standard deviation | CV | Reading |
|---|---|---|---|---|
| Cafe A wait time | 4.0 min | 0.5 min | 12.5% | Consistent, predictable |
| Cafe B wait time | 4.0 min | 3.0 min | 75% | Wildly variable |
| Salaried paycheck | $1,200/wk | $50 | 4.2% | Very stable income |
| Gig-work income | $1,200/wk | $400 | 33.3% | Feast or famine |
Both cafes advertise the same average wait, but only one of them ever takes 10 minutes. The CV also lets you compare spread across different units entirely, like heights in inches against weights in pounds, where raw standard deviations can’t be compared at all. Since CV is just a percent calculation, the same method from our guide on how to calculate percentage applies: part over whole, times 100.
How Do You Find Standard Deviation in Excel or on a Calculator?
Nobody computes standard deviation by hand twice. The catch is that every tool offers both formulas, and the buttons don’t announce which is which. Here’s the decoder:
| Tool | Sample (÷ n - 1) | Population (÷ N) |
|---|---|---|
| Excel | =STDEV.S(range) or older =STDEV | =STDEV.P(range) or older =STDEVP |
| Google Sheets | =STDEV(A1:A20) | =STDEVP(A1:A20) |
| TI-83/TI-84 | Sx in 1-Var Stats | σx in 1-Var Stats |
| Most phone/stat apps | Usually labeled s or “sample” | Usually labeled σ or “population” |
In Excel or Sheets, type your values into a column, click an empty cell, and enter =STDEV.S(A1:A20) with your own range. On a TI-84, press STAT, enter the data in L1, then STAT again, over to CALC, choose 1-Var Stats, and read both Sx and σx from the output screen. The calculator prints both every time; picking the right one is on you.
Two habits prevent most spreadsheet errors. First, spot-check the range: a stray blank or text cell silently changes the count. Second, sanity-check the output against the rule that nearly all values should fall within 3 standard deviations of the mean. If =STDEV.S returns 45 on data that only spans 20 units, the range grabbed something it shouldn’t have.
How Does an Outlier Change the Standard Deviation?
Because every deviation gets squared, values far from the mean don’t just add to the standard deviation, they dominate it. One wild data point can swamp everything else, and seeing that happen once will change how you read summary statistics forever.
Take the quiz scores from earlier and change a single number: the 90 becomes a 190 (say, a typo while entering data). Watch what happens:
| Original data (66, 74, 82, 88, 90) | With outlier (66, 74, 82, 88, 190) | |
|---|---|---|
| Mean | 80 | 100 |
| Sum of squared deviations | 400 | 10,400 |
| Sample variance | 100 | 2,600 |
| Sample standard deviation | 10 | 51 |
One typo moved the mean by 20 points and multiplied the standard deviation by five. The squaring step is the culprit: the outlier’s deviation of 90 becomes 8,100 when squared, which is more than twenty times the combined contribution of the other four values.
Two practical lessons follow. First, always scan your data before trusting the output; a standard deviation that looks absurdly large is often a data-entry error, not real spread. Second, for data with legitimate extreme values, like household incomes or home prices, the standard deviation can paint a misleading picture of the typical case. Statisticians reach for the interquartile range in those situations, since it ignores the extremes entirely. The standard deviation shines on roughly symmetric data and struggles on heavily skewed data, and knowing that boundary is half of using it well.
Standard Deviation vs Variance: What’s the Difference?
Variance is the step you pass through on the way to standard deviation: it’s the average of the squared deviations before you take the square root. The two numbers carry the same information but wear different units, and that changes what each is good for:
| Variance | Standard deviation | |
|---|---|---|
| Symbol | σ² or s² | σ or s |
| Formula relation | Average of squared deviations | Square root of variance |
| Units | Original units squared | Original units |
| Quiz example | 100 points² | 10 points |
| Best for | Statistical theory, ANOVA, combining spreads | Interpreting and reporting real data |
“Points squared” means nothing to a reader, which is why reports quote standard deviation. Variance earns its keep inside statistics, where its math behaves better: variances of independent variables add cleanly, standard deviations don’t. For everyday use the rule is simple: compute through variance, report the standard deviation.
What Are the Most Common Standard Deviation Mistakes?
The method is mechanical, but four specific slips produce most wrong answers. Each one has a quick fix:
| Mistake | What it looks like | Fix |
|---|---|---|
| Wrong denominator | Dividing by n for a sample (or n - 1 for a population) | Whole group in hand: N. Subset standing in for more: n - 1 |
| Reporting variance | Stopping at 100 instead of taking √100 = 10 | The last step is always a square root; check the units make sense |
| Dropping negatives | Treating -14 as 14 before squaring, or losing the sign in Step 2 | Deviations must sum to 0 before squaring; if they don’t, recheck |
| Comparing raw SDs across scales | ”SD of 50 beats SD of 5” when one mean is 1,000 and the other is 10 | Divide by the mean first and compare CVs instead |
The deviation-sum check in row three is worth making a habit. It costs five seconds, and it catches subtraction slips before they poison every later step. The units check in row two is just as fast: a standard deviation should always be a plausible distance in the data’s own units, so a “standard deviation” of 400 on quiz scores that range from 66 to 90 means a square root got skipped.
Standard deviation rewards doing it by hand exactly once, so the formula stops being a mystery, and then letting software carry it from there. Work through your own numbers with the step-by-step solver, compare the sample and population answers, and you’ll never wonder which button your calculator wants you to press again.
Frequently asked questions
The lowercase Greek letter sigma (σ) stands for population standard deviation, and the letter s stands for sample standard deviation. Their squares, σ² and s², are the population and sample variance. You'll also see μ for a population mean, x̄ for a sample mean, and Σ meaning 'add everything up.'
No. Every deviation gets squared during the calculation, so the sum can't go below zero, and the square root of a non-negative number is never negative. The smallest possible standard deviation is 0, which only happens when every value in the data set is identical.
It depends entirely on the mean and the context. A standard deviation of 5 is huge for data averaging 10 and tiny for data averaging 10,000. Divide the standard deviation by the mean to get the coefficient of variation: under about 10% usually reads as consistent, while past 30% the data is genuinely spread out.
A sample's values sit closer to their own average than to the true population mean, so dividing by n would understate the spread. Dividing by n - 1, called Bessel's correction, inflates the result just enough to fix that bias on average. With every value of a population in hand, you divide by N instead.
Type =STDEV.S(A1:A20) for a sample or =STDEV.P(A1:A20) for a full population, swapping in your own cell range. Google Sheets uses the same two functions. The older =STDEV formula still works and matches STDEV.S, so spreadsheets assume sample data unless you say otherwise.
It's the standard deviation expressed as a percentage of the mean: divide the standard deviation by the mean and multiply by 100. Also called the coefficient of variation, it lets you compare spread across data sets with different units or scales, like heights in inches against weights in pounds.
Standard deviation measures how spread out individual values are. Standard error measures how much a sample's mean would bounce around if you repeated the sampling, and it equals the standard deviation divided by the square root of the sample size. Bigger samples shrink the standard error but not the standard deviation.
Calcowa's editorial team builds and checks every calculator against published formulas, then writes these guides so the numbers make sense. Each tool shows its formula and a worked example. See our methodology.
Related guides
How to Calculate Percentage (with Examples)
How to calculate percentage: divide the part by the whole and multiply by 100. Get all 3 percent formulas, mental math shortcuts, and worked examples.
Health & FitnessTarget Heart Rate Zones for Fat Loss
Target heart rate zone for fat loss runs about 60 to 70 percent of your max heart rate, but higher zones burn more total fat. Get the full chart and math.
Health & FitnessCalories Burned Walking: A Complete Guide
Calories burned walking depends on your weight, pace, and incline. A 155-pound person burns about 86 calories per mile at a moderate pace. See the charts.